Moving, Challenges, and Building a Personal Budgeting App.

In 2017 I moved to Bed-Stuy Brooklyn and a day later I found out I was hired at Uniqlo. I moved out on a whim, without an income, and it luckily all fell into place. I lived there until school started up again that fall. Flash forward to 2021, I decided to once again move out of my parents’ residence; where I was fortunate enough to live without paying rent and many other perks that I often took for granted.
Was there a mystical correlation between moving and obtaining work that I believed could strike true once again? Partly and truly I am still holding out hope…
I want to live my life taking leaps and chances. Moreover, through this past year, for a multitude of reasons, I found myself getting stagnant. I worked on my portfolio site… and I worked on my portfolio site… and I, well you get it. I just never seemed to get it “right”. Finally after 5 iterations I decided I had to stop redoing it.


Upon moving, I found myself facing a whole new host of challenges. And if art school taught me anything, it is that these challenges can be turned into creative problem solving situations. Having trouble finding a bathroom when out in the city? Why not create a crowdsourced bathroom map app… and so on and so forth.
I am definitely an ideas person. So, now that I am in a new city, with new challenges, I decided to pick one and try to solve it with my own flair.
Budgeting.
I have never considered myself to be a frugal person. Not that I am out here buying extravagant items, but I am very good at making excuses for why I “need” something I really don’t need.
I know there are plenty of apps out there for budgeting… but it was a project I wanted to take on and make it my own.

My app is still in early stages, in fact it at the time being is fully static — meaning that the data is all entered in the code. It is not yet formatted with a backend and that ye olde CRUD (CRUD is an acronym for the four basic types of SQL commands: Create , Read , Update , Delete) abilities.
As seen in the screenshot of the codebase, I am manually entering my expense data. My favorite to date is the ‘site hosting’ which in the comments reads: “I should cancel this…”.
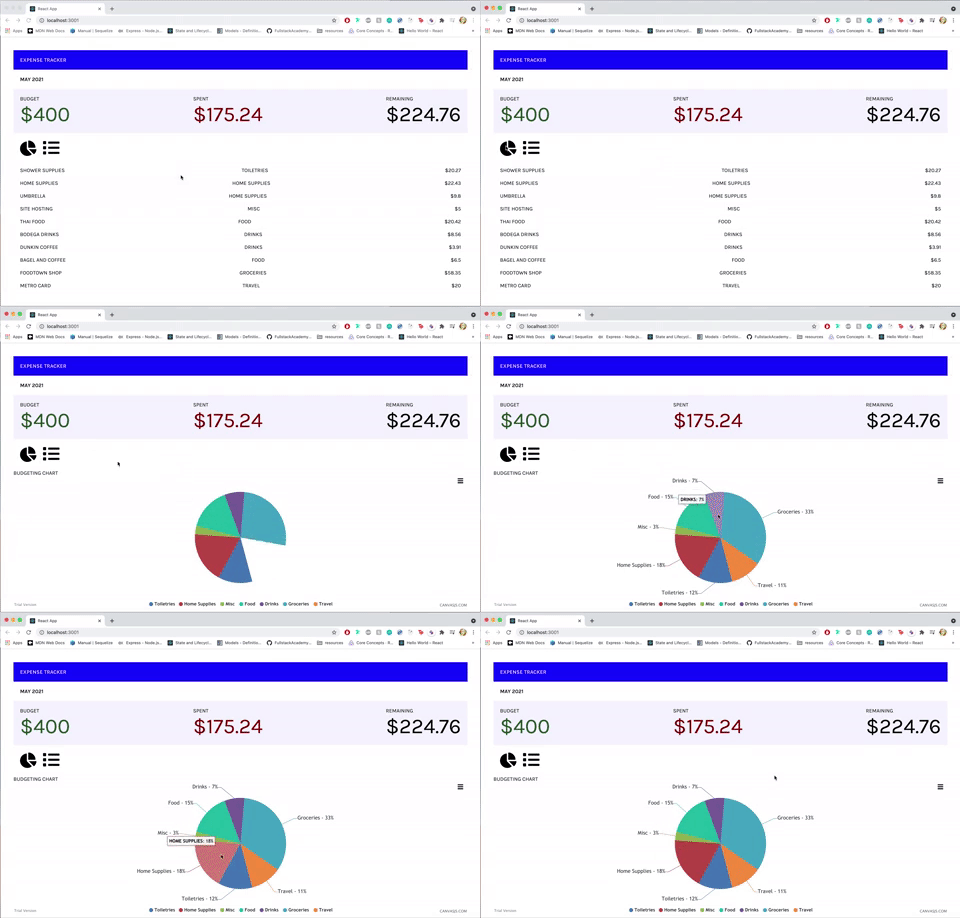
I am then using this static data and displaying it in a list as well as, and this is the exciting part — for me at least, a pie chart.

For now the pie chart is created with a trial version of CanvasJS React. In order to get the percentages correct for each amount spent on each category I had to do some algorithmic problem solving. It was a head scratcher at first. And honestly upon solving this and creating the pie chart I felt more accomplished than I have in months. Which is truly a testament to the power of coding — that feeling when you’re up against a wall and then make it through to the other side — arguably the best feeling.
import React, { Component } from 'react';
import { expense } from '../Data.js';
import CanvasJSReact from '../assets/canvasjs.react';const CanvasJSChart = CanvasJSReact.CanvasJSChart;let sum = expense.reduce((accum, item) => accum + item.spent, 0);function findPercentage(arr, value) {
  let sumNum = 0;
  arr.map(item => {item.category === value ? (sumNum += item.spent)     : (sumNum += 0);});  return parseInt(Math.round((sumNum / sum) * 100));
}class Graph extends Component {
  render() {
  const options = {
  exportEnabled: true,
  animationEnabled: true,
  data: [{
    type: 'pie',
    startAngle: 75,
    toolTipContent: '<b>{label}</b>: {y}%',
    showInLegend: 'true',
    legendText: '{label}',
    indexLabelFontSize: 16,
    indexLabel: '{label} - {y}%',
    dataPoints: [
       { y: findPercentage(expense, 'Toiletries'), label: 'Toiletries' },{y: findPercentage(expense, 'Home Supplies'),label: 'Home Supplies',},{ y: findPercentage(expense, 'Misc'), label: 'Misc' },{ y: findPercentage(expense, 'Food'), label: 'Food' },{ y: findPercentage(expense, 'Drinks'), label: 'Drinks' },{ y: findPercentage(expense, 'Groceries'), label: 'Groceries' },{ y: findPercentage(expense, 'Travel'), label: 'Travel' },],},],};

  return (<div><div>Budgeting Chart</div><CanvasJSChart options={options}/></div>);}}export default Graph;
Hopefully I will continue developing my budgeting app and take it from its current static state to fully fleshed out dynamic application. I would want to take more time to research what is out there and what value proposition I could add to the space before making it public. For now it has been a fun challenge… which solves, for me, the not-so-fun challenge of budgeting.

Thanks for reading and stay safe!
